
Visual content is in high demand. Every piece of content you create in social media, web design or blog post can be greatly enhanced by adding visual elements that complement your content. Posting relevant images in your posts can yield a 94% higher page views compared to a text post without images.
Infographics are used in correlation with written content for the reader as a visual explanation of the content being discussed. Variations’ of colors and design are used to give your post a visual impact that grabs the attention of the reader. A blog post with good content will not even get noticed. Adding infographics, digital photos or graphics can make a huge impact on your content presentation.
The best practices on visual media for social sharing sites such as Facebook, Twitter and Pinterest are essential in conveying your personal message. Photos and images are referenced as key elements when sharing social media and are considered an important part of visual communication. Look at the most popular websites and blogs on the internet today and you will find great example of infographics being used to demonstrate or illustrate a message to the reader.
Illustrator CC Tutorial/ Graphic Design/ Vector Infographics
Visual Content is King
We live in a visual world where we are constantly reading or working on the computer, tablet or cell phone. Using infographics is a way of simplifying the communication process with bold colors and design in a compact form with easy to read relevant information and giving the reader a quick guide to reference in your post. The infographics can contain information about your topic including graphs, statistics, percentages, titles, and descriptions, small snippets of content, digital photos, add web address leading to a sales page and you can even add a link connecting your graphic to another website or promotion.
Infographics are heavily used in advertisements and promotional materials around the world giving every ad blog or website a visual impact for the consumer. Our brains process visual content more efficiently giving visual content more interesting and engaging than a plain text article. Visual content is one of the most powerful forms of communication and can quickly capture attention to your content. Visual content is more attractive and appealing making infographics one of the best online marketing tools on the internet today. Facebook and other social media and blogs are required to post visual communication in their posts though infographics, digital photos or video along with relevant content. Graphics are a great way to showcase your content and make your post visually appealing to others.
 Visual Content Statistics
Research shows that colorful visuals increase the willingness of your article being read by 94% and 80% on Twitter. When people hear information they only retain 10% of that information three days later, however when you combine the same content with relevant visuals that information is retained 65% more three days after it was viewed.
46% of marketers say that using photography and other visuals in their marketing strategies is crucial to their promotional success. 35% Marketers selected visual assets as being the most important part of their blog post 45% in videos. Content with reverent visuals gets 94% more views than content without illustrations, photography or graphics.
65% of senior executives say that graphics, photography, illustrations and infographics are the core of their marketing campaigns making advertising and content more visually interesting to the consumer. Only 27% of marketers have a visual marketing strategy in place to implement and organize their campaigns. 73 % of content creators plan on publishing more engaging content.
 Creating Your Own Infographic
Canava.com is the easiest design program in the world. Join with 10 million other users who have discovered this program online. Join for free and get access to the design program and tutorials. Create your own custom designs using specific dimensions, digital photos, templets and graphic tools used in layout design. Templets for social media, Facebook and Twitter, posters, Infographics, presentations, Facebook cover, Facebook post, blog graphic and EBook are included in your membership. You can upgrade at any time for more benefits. Send you latest creation to Facebook, Twitter and email. Upload your file to a Paint program and save for your website, blog or advertisement use. Canva is easy to use and will enhance any content publication with interesting visual elements.
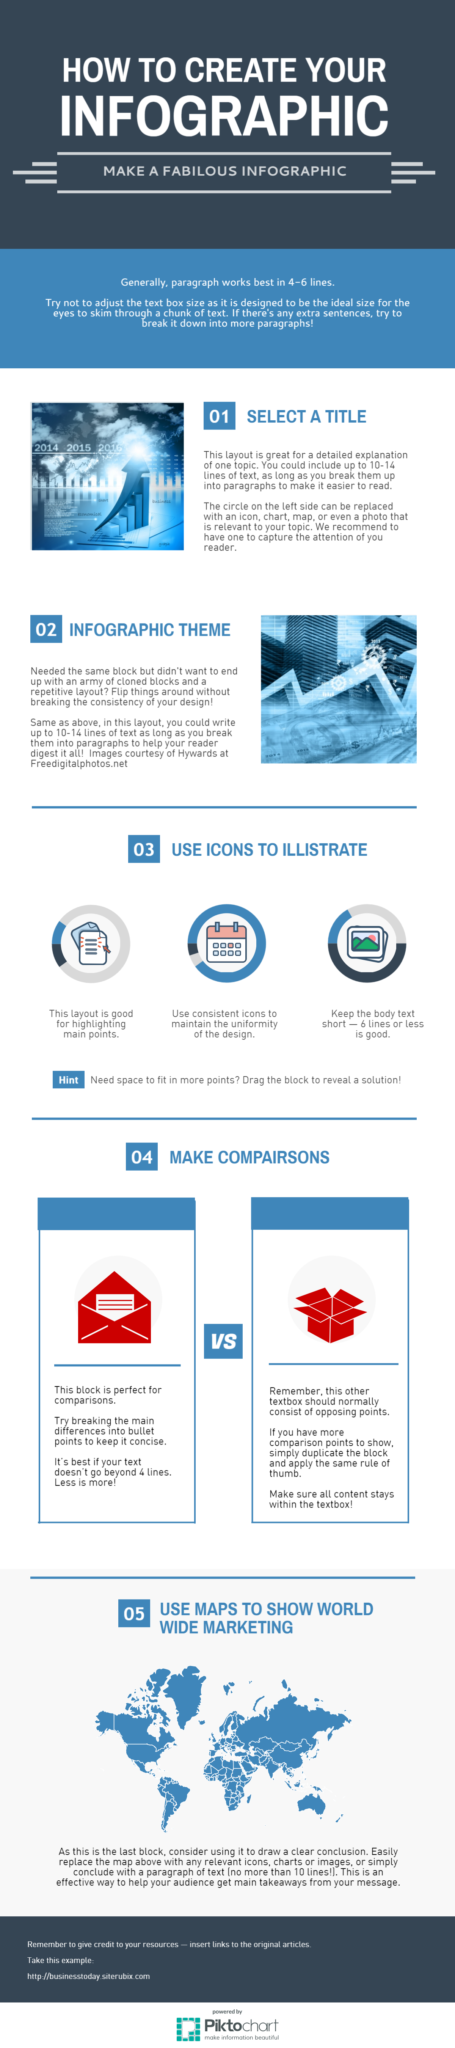
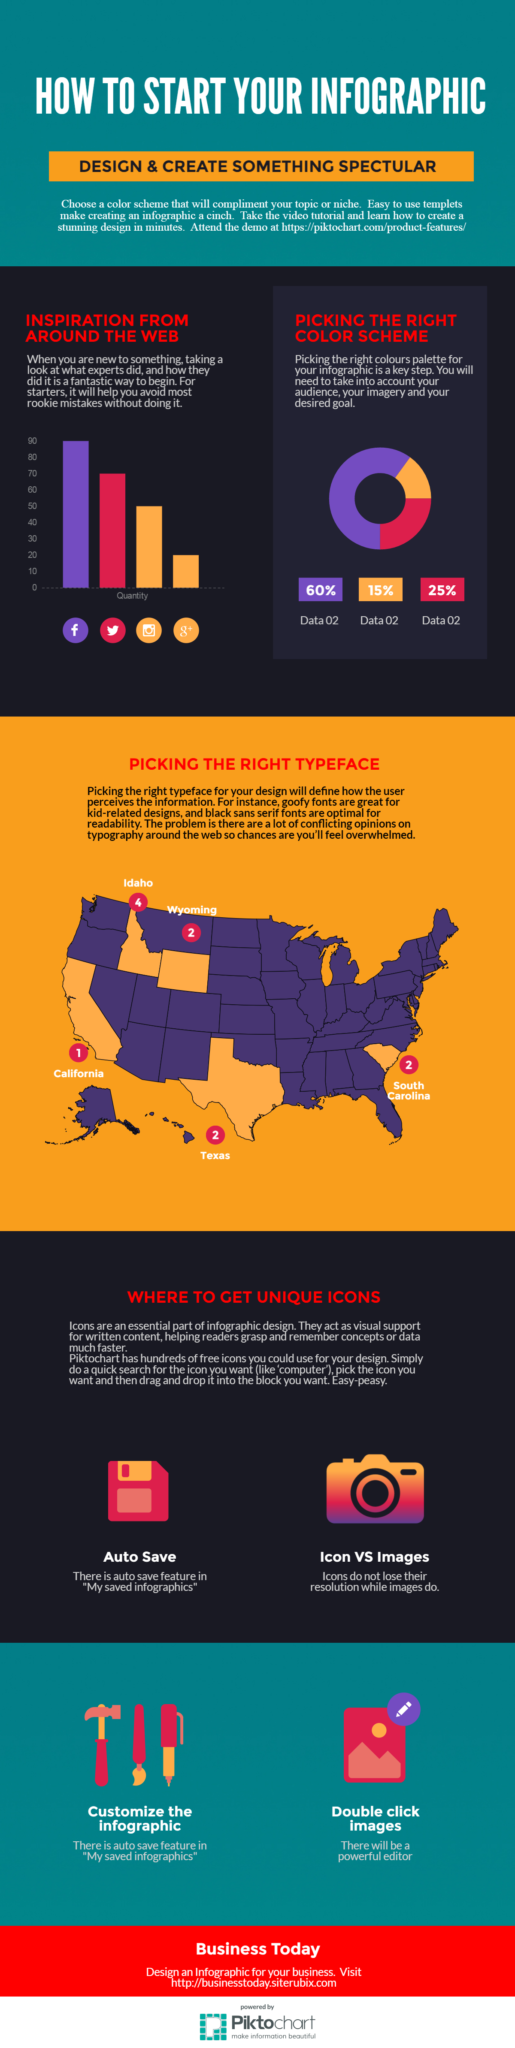
Piktochart.com empowers you to create powerful visuals without the hiring costs of a designer. Create your FREE account and join over 4 million other users who have used this software to design graphics for their blogs, websites and business. Design presentations, posters, reports and more. Get free video tutorials and customer support to get you started. A free life time account includes unlimited graphic creations at no extra cost. Access all 4,000 icons and images to enhance your designs with full editor functions. Once you are finished your masterpiece, use social sharing buttons to send out your latest creation. Got to https://magic.piktochart.com
Google chart tools at https://developers.google.com/chart are powerful simple and free to use. You can choose from a verity of extensive options and configure your charts to perfectly match the look and feel of you website. Connecting your data in real time. Google developers is the perfect infographic design solution
Easel.ly creates and share visual ideas with 1000’s reporting timeline, resume and process templets to choose from. 4,000,000,000 infographics created so far and counting. This free web based infographic tool offers you a dozen free templets to start you off with and is fully customizable for your specifications. Access graphic tools in design elements and upload your digital photos to customize your layout. Go to http://www.easel.ly
Venngage.com a free infographic design program for creating posters, infographics, resume, reports and presentations. Upgrade your account to receive a more extensive tools and templets. Publish and download you creation to anyone anywhere on social media sites Facebook, Twitter, Pinterest, blogs and websites. This software is easy to use with templets and drag and drop selections for your design elements. Create an Infographic today.
The FREE Templets you need for Visual Content Design
- 555 Royalty Free Stock Photos
- 195 Visual Marketing Templets
- 15 FREE Infographic Templets
- 100 FREE Templets for Visual Social Media Content Marketing
- 5 per sized Social Media Templets FREE download
- 5 SlidShare Presentation Templets
- 3 Power Point Presentation Templets
- 18 EBook Templets
Learn how to create your own stunning presentations with free downloadable software that uses a verity of templets to make your designs look professional and vibrant. Increase your visibility and online popularity with visual content and social media marketing strategies.
Promote Your Business with Infographics
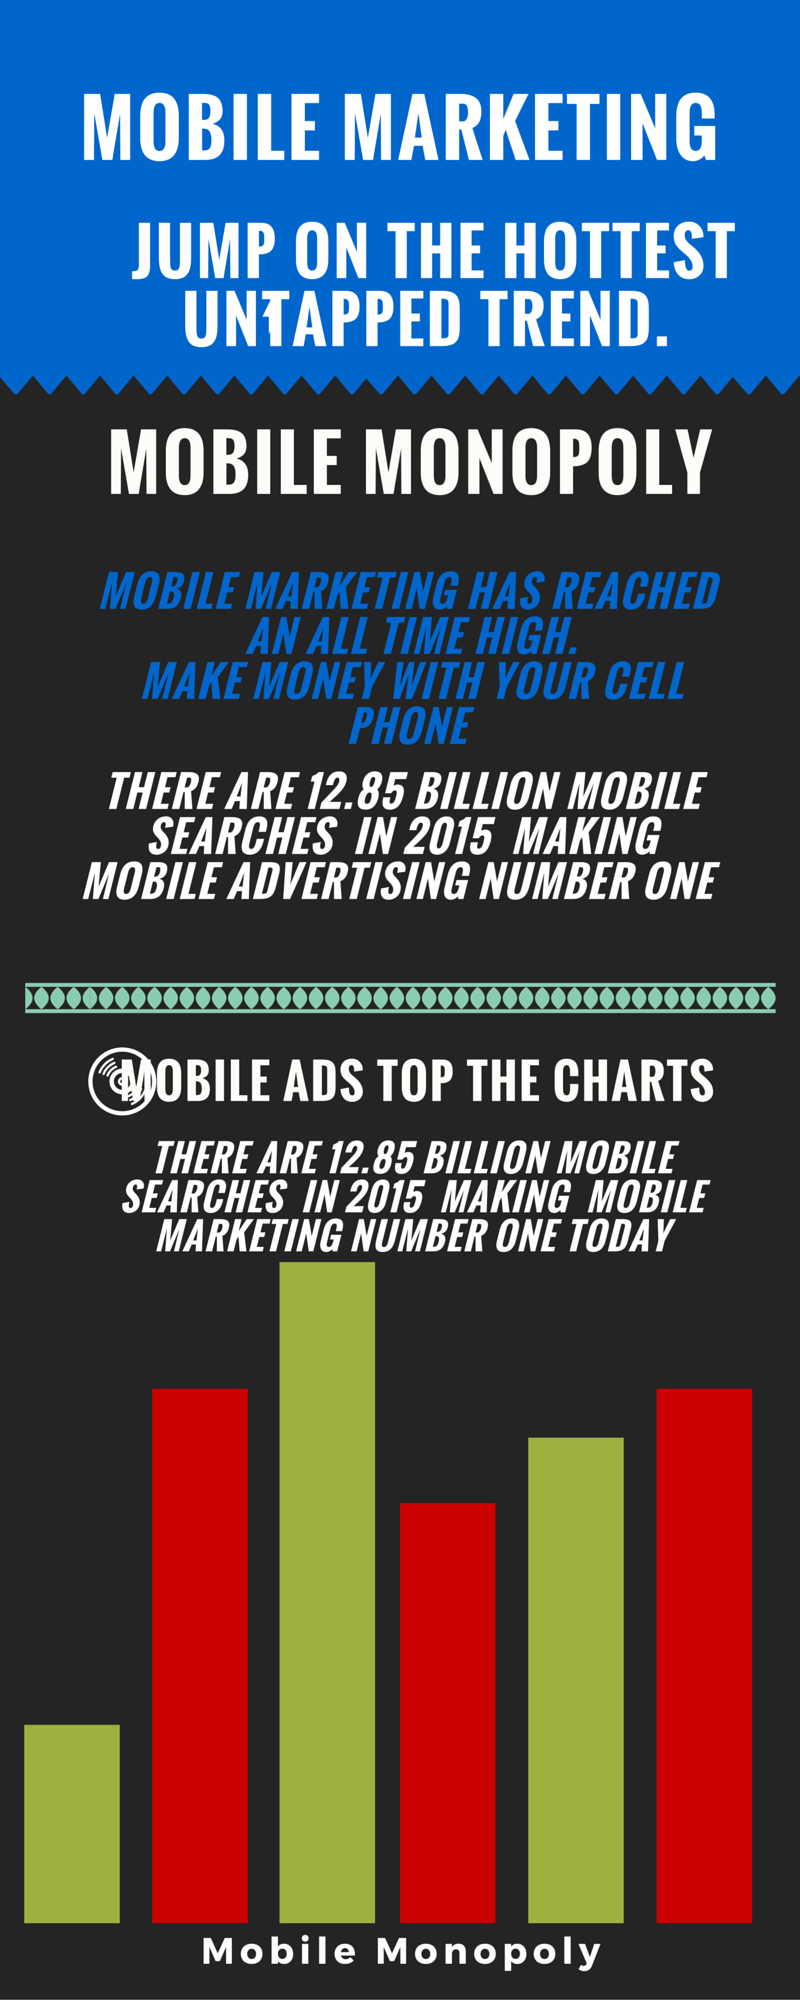
This infographic is designed for the product Mobile Monopoly 2.0 Make money online with Mobile Monopoly the hottest new product sold online today. Adam Horwitiz shows you how to consistently earn 1,005.00 per day putting ads on cell phones. This infographic has been shared on blogs, Pinterest and the internet. When you click on the infographic you will be directed to the offer and sales page to view. This is an excellent way to advertise your affiliate offers, services and promotions through infographics
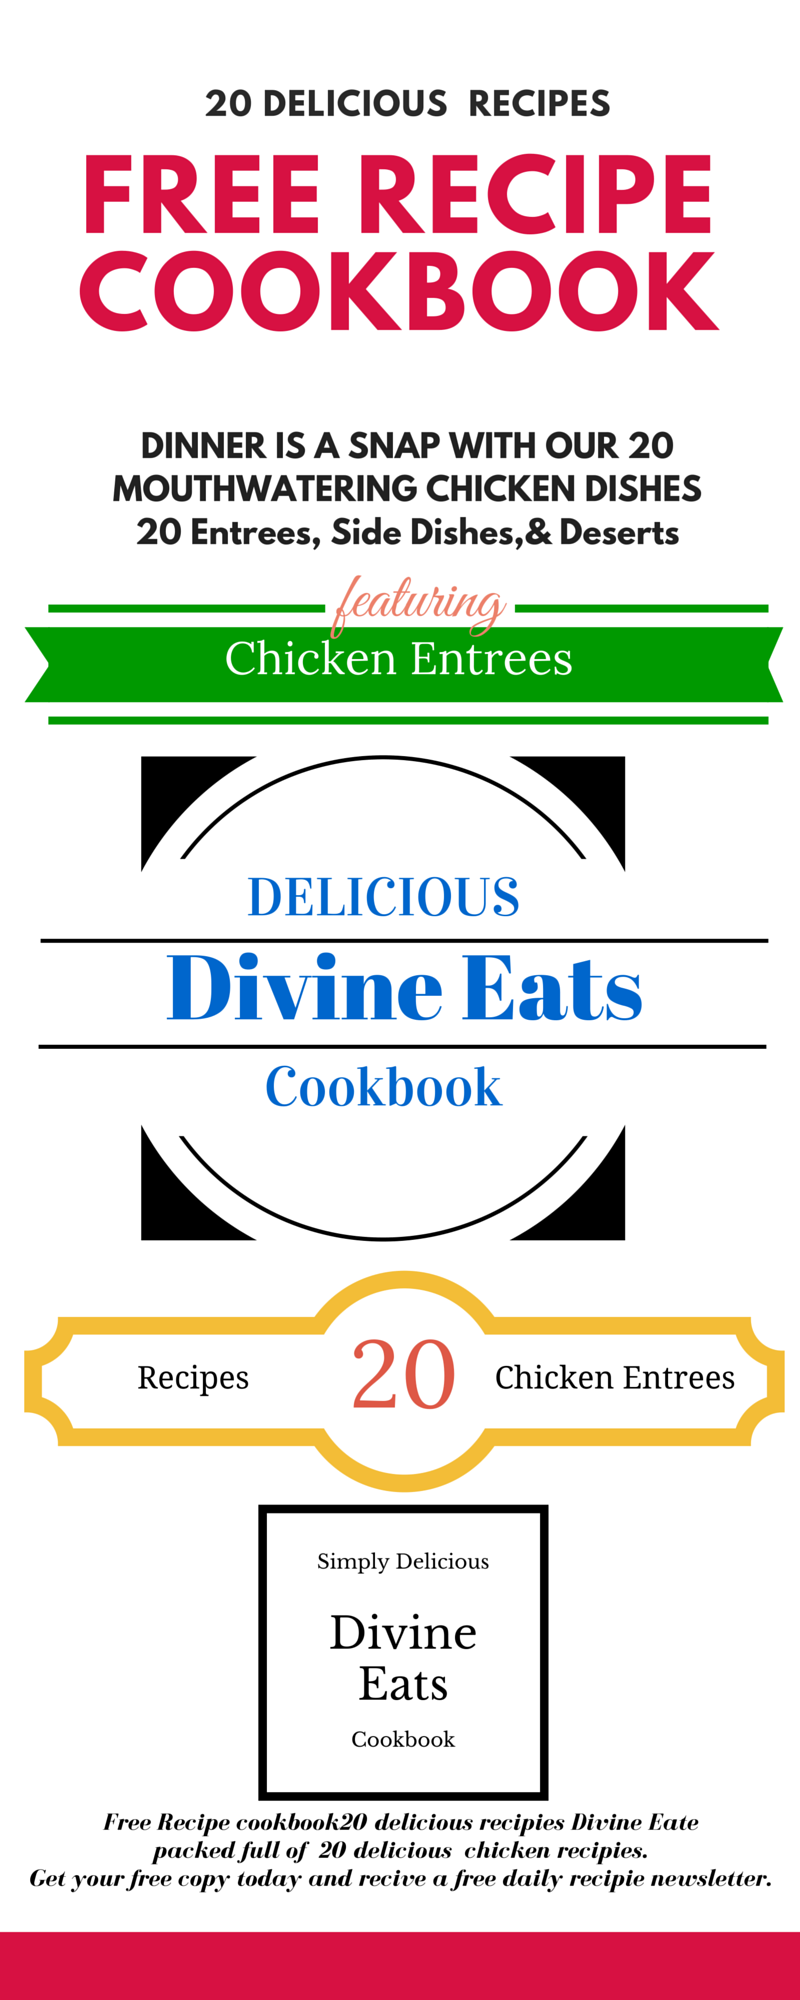
Divine Eats offers a FREE recipe Cookbook filled with delicious chicken Entrees, side dishes, drinks and deserts. This infographic was shared on social media, Facebook, Twitter, Pinterest, Instagram, advertisements, blogs and internet. Once your infographic is published it will be shared throughout social media driving free traffic to your affiliate offers. The affiliate makes money when someone clicks on the infographic that directs the consumer to the affiliate offer. If the consumer wants the FREE chicken recipe book they are asked to submit their email and then download a digital copy of the recipe cookbook. The Affiliate promoting this offer gets paid when someone enters their email.

This infographic was specifically designed to be placed in Classified Ads and is smaller in size. This inforgraphic was designed for Earn Cash Yearly a internet based business that sells profitable websites online that generates an income with advertising, Google and Clickbank. Once a consumer purchases a website package the consumer will receive a website, custom domain name and hosting. Advertisements will be placed on the website. The consumer earns money when someone clicks on the advertisement. Their profitable website will generate an income online even while they sleep. That is the power of the internet.
This infographic is posted on social media, Facebook, Twitter, Pinterest, website, and blogs. Once a consumer clicks on the infographic they are directed to the website showing a video presentation and offering a method of making money online with a complete 300 page+ website. This infographic was designed at www.pikochart.com. Once a design is published and goes public you can easily send out your promotions to social media with a click of a button. A well designed infographic can generate thousands of dollars in revenue and is considered an essential part of any online marking campaign.
Neil Petal Blog created one infographic that generated 19,000.00 online for his business. Click here to see examples of the graphics and illustrations he uses on his website http://www.neilpatel.com Neil Patel shares his personal journey and now attracts 100,000 visitors to his website per month.
For great examples of infographics go to Google Images and search Infographics to get great ideas and insperation for your designs. CLICK HERE
Resources for Infographics
Create spectacular designs for your website, blog and advertisements. Using Infographics will attract 94 % more visitors to your business and is considered an essential part of any web based design. Here are a few great resources you can use for free to get started.
Canva.com the easiest design program in the world. Join for free and get access to tools and templets you need for presentations, blog posts, Facebook fan page and much more
Take the tour and access the free tutorials in design.
Piktochart.com a free infographic design program complete with easy to use templets for your graphic designs, blog posts, social media exchanges and presentations. Get instant access to their tutorials, tools and design program.
http://all-free-download.com that offers Free Adobe Illustrator Vectors templets, 2,472 free website templets, free icons, and free photos. This is an excellent resource for designing online.
Viseme.com easily makes professional designs for your blog, website and social media posts. This is a free service and is easy to use software for infographic design with hundreds of templets to choose from. Drag and drop text, charts, media and video to enhance your creative design.
Adobe Illustrator
Adobe Illustrator CC software. Create beautiful vector art with this program. This is the industries standard graphics app that allows you to create sketches, logos, infographics, and typography, complex illustrations for web and video projects. Go to www.adobe.com for more information there is a fee associated with this type of software however it is one of the best design programs available online today.
Follow me on Facebook. & Twitter Leave me a comment
Patricia lynn
Images Courtesy of Haywards at FreeDigitalPhotos.net
Author of Business Today Pro. Providing the latest news and update information on business, online marketing, tech, how to make money online, how to make money with advertising, websites, blogging, affiliate marketing and much more…
Hi, I tried so many times to make a infographic but failed all the times. I hope your post will help me and inspire me and also will give ideas for my infographics.
Making Infographics can completely transform any blog or social media post by using digital visualization to describe your content. If you are just starting out there are fantastic online tutorials for beginners. Create beautiful graphics for free with Canva.
Follow the Ultimate graphic design tutorials by Canva giving you step by step instruction on how to design and customize your own infographics, images, social media posts, posters, presentations and more… Join Canva and also receive tutorials, examples and tips on how you can make great graphics for your projects. If you are still having difficulty making infographics, classes are available at most college facilities in graphic design and digital photography. You will be amazed at what you can accomplish with graphics. Follow my next post Infographics for beginners for more tips and resources.
Cheers!
Patricia Lynn